Visualizing Resources
how we did it
Created by Aixbel Martinez / @aixbel
The Graphical Web 2015: Motion, Meaning, Stories, Standards, Pictures for everyone.
September, 2015
Data Visualization
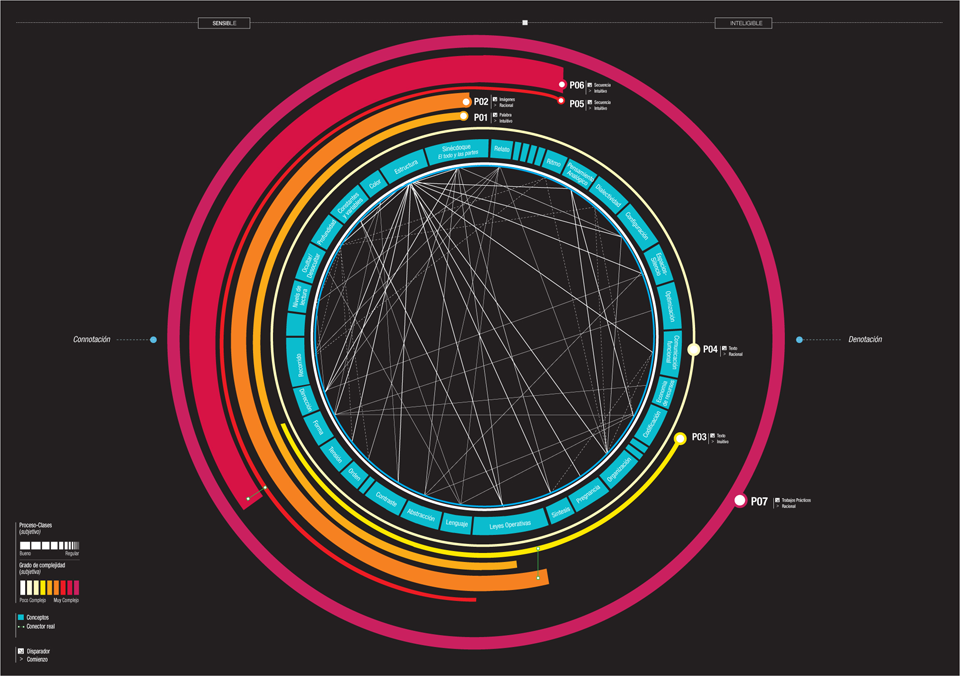
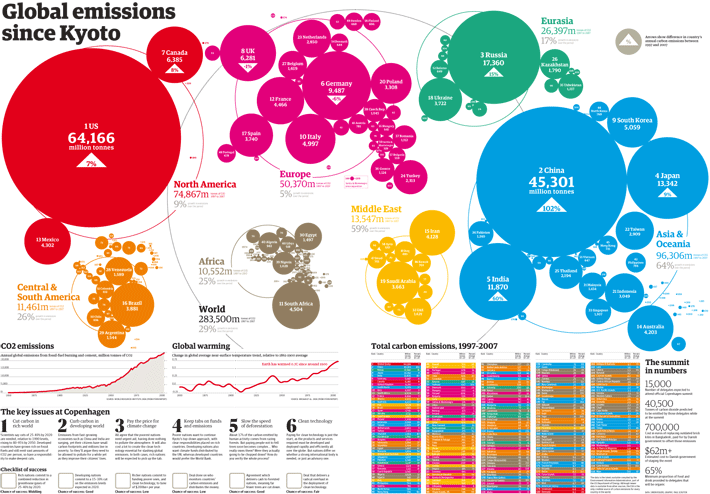
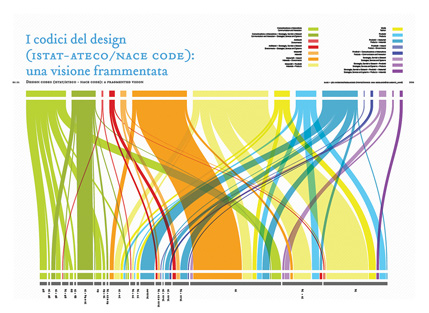
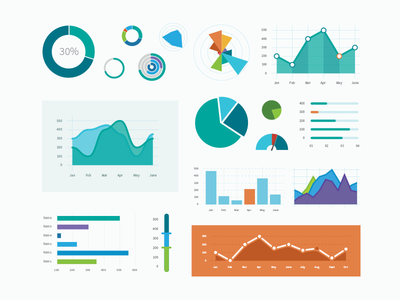
"Real World" Data Visualization
Some day at Work..
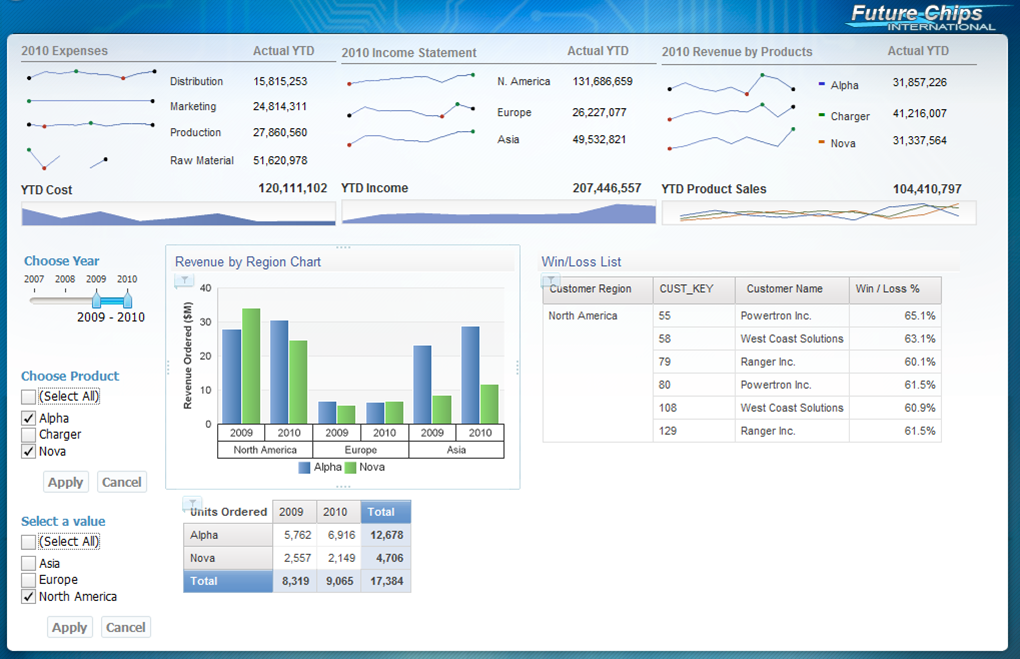
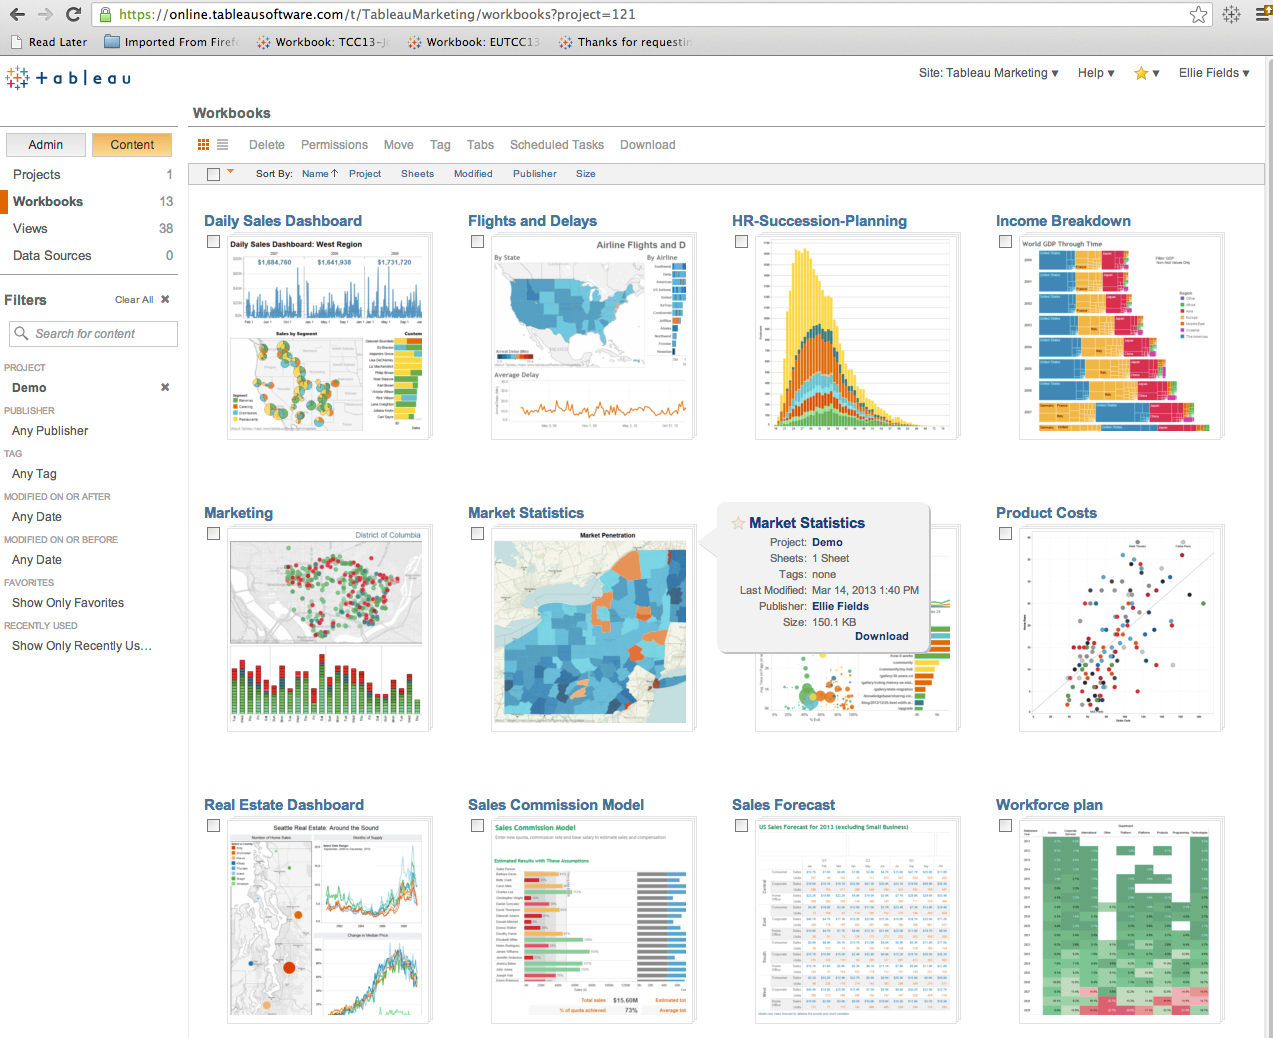
Create a dashboard that allowed us to Visualize our Resources by product
What to do?
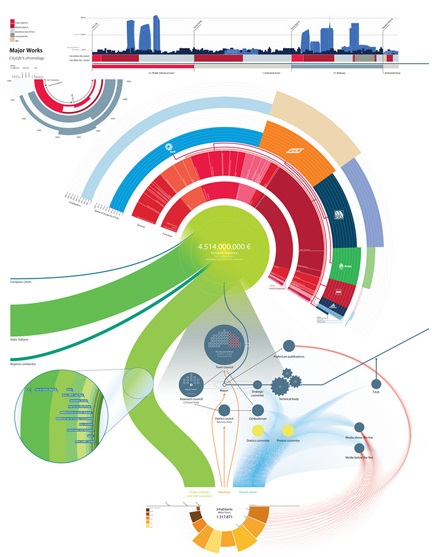
Expectation
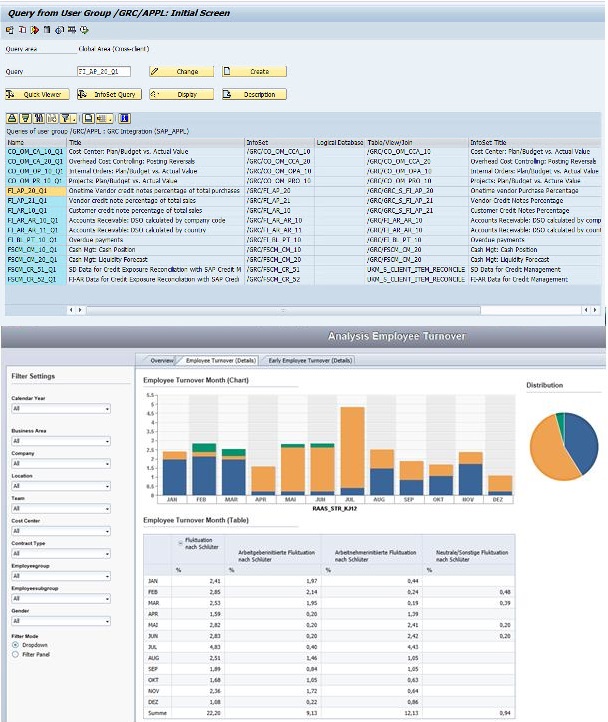
Reality
I decided to break the gap

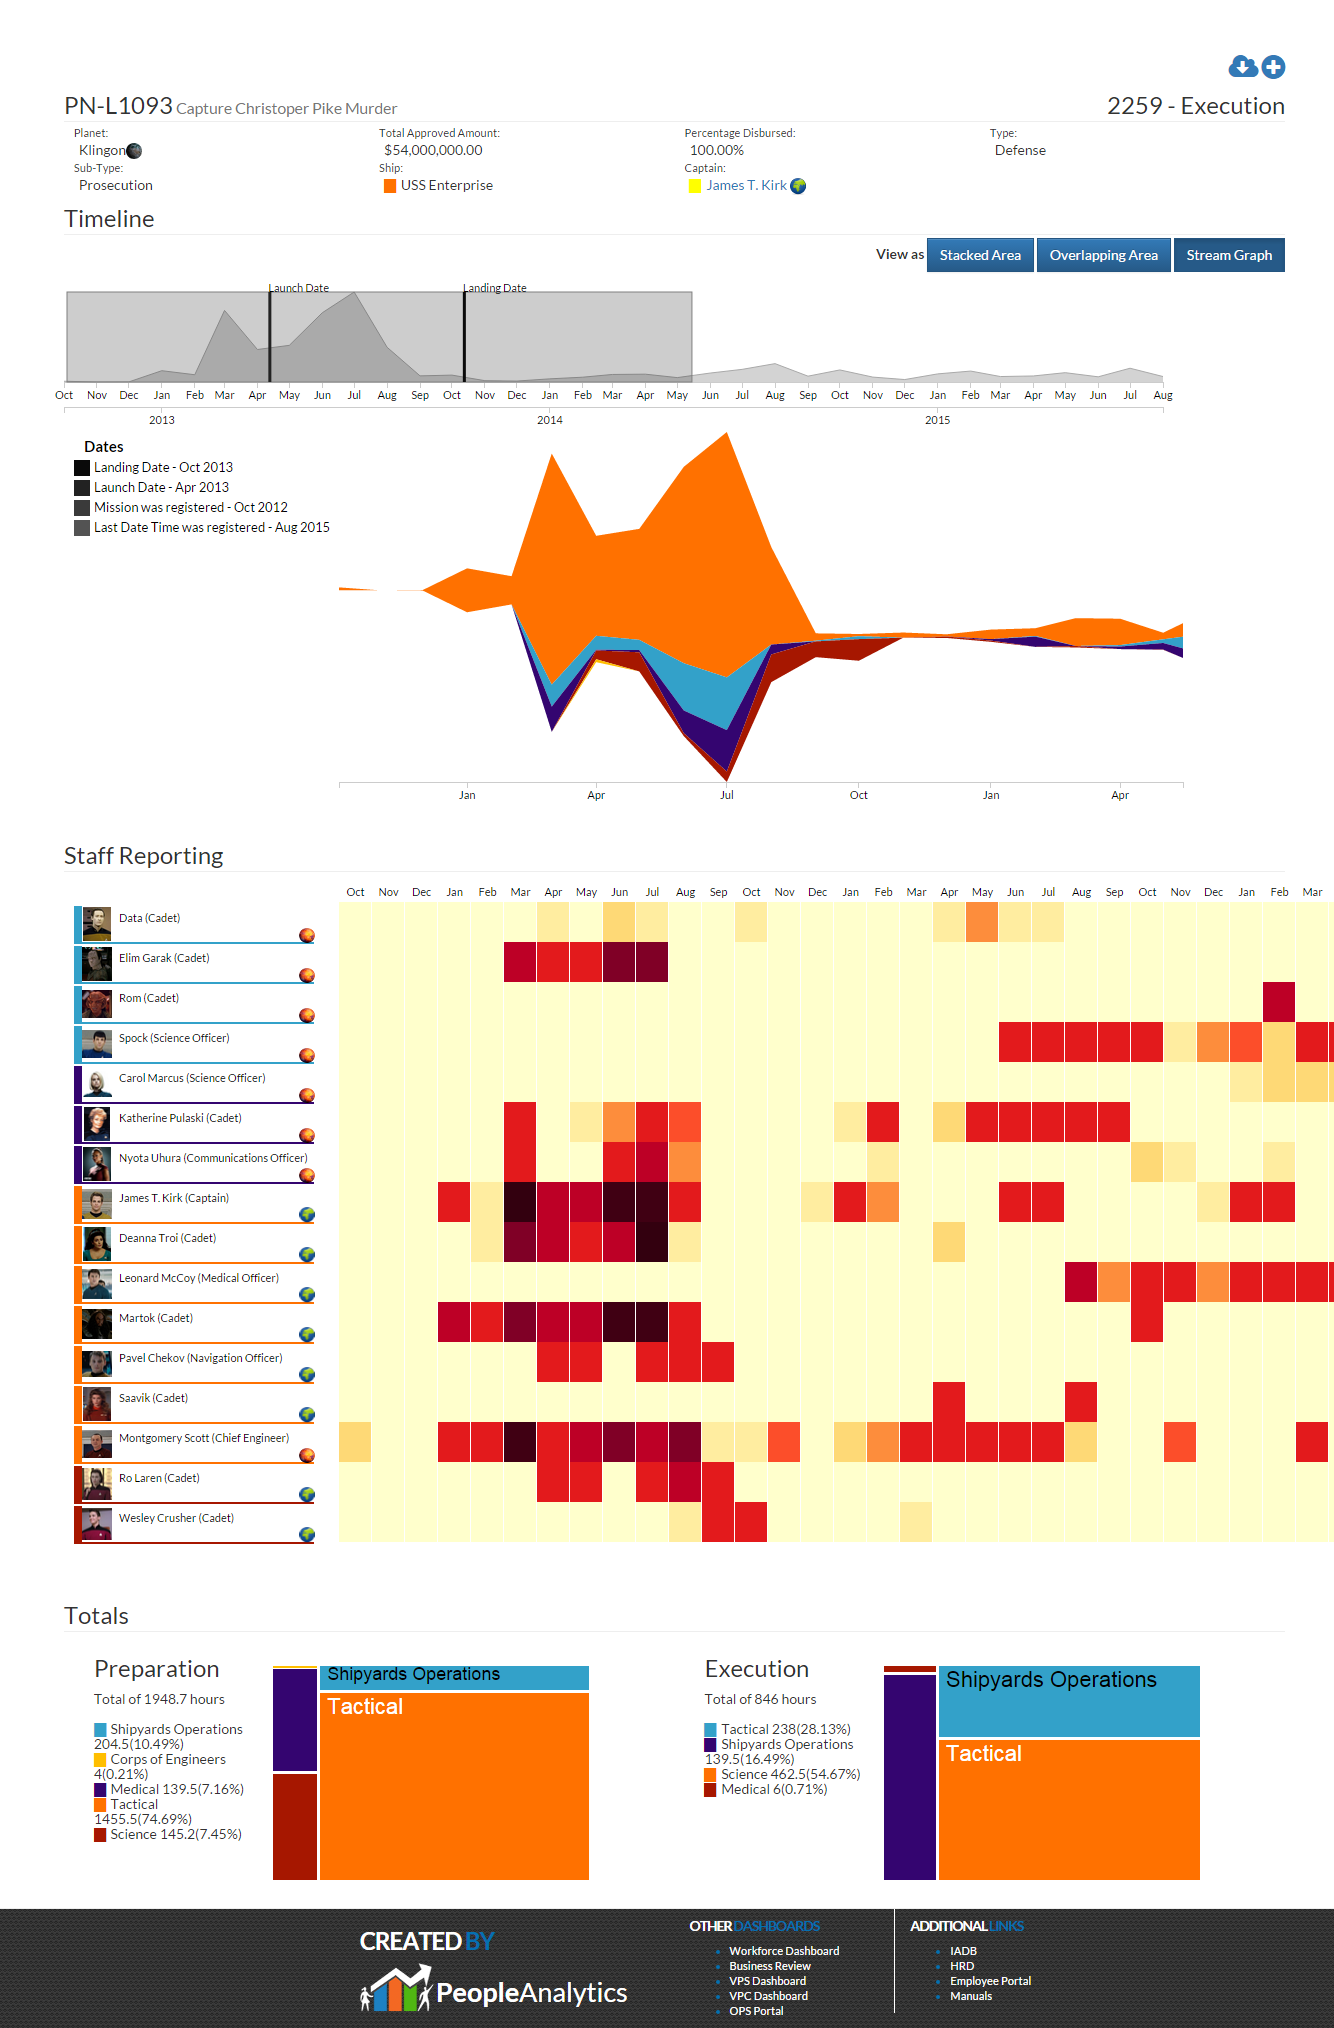
Create a dashboard that allowed us to Visualize our Resources by mission
@Starfleet Academy, from Star Trek
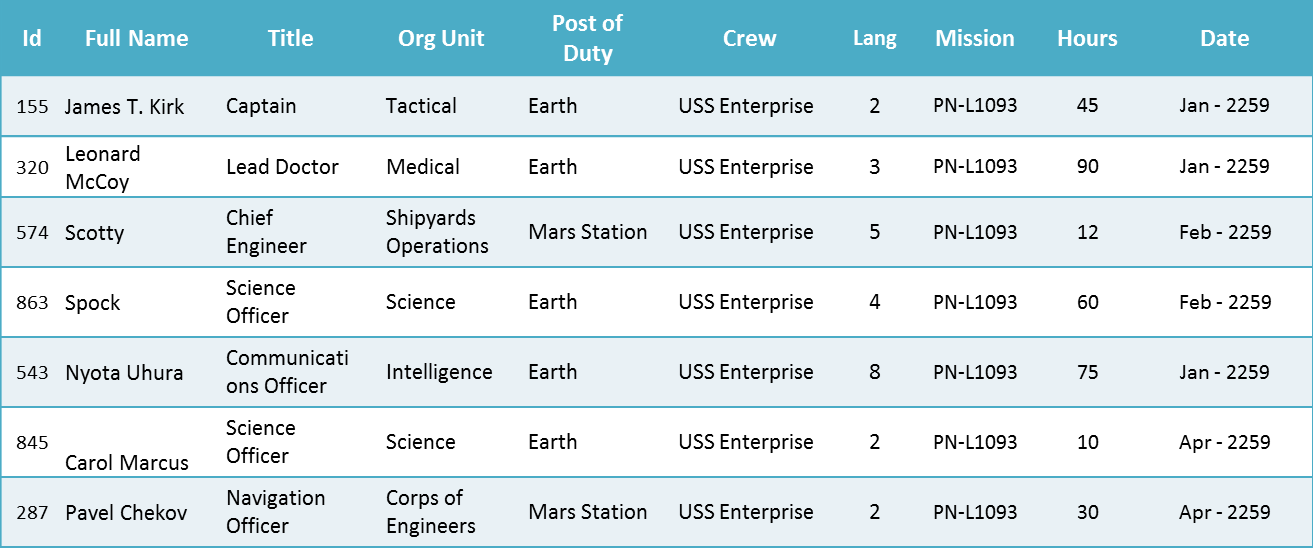
- Focus first on the areas that you know. Human Resources
- Divide the problem, answer one question at the time
Who much effort(people) was placed on the mission to get to Klingon to capture Khan
[Star Trek Into Darkness]
- What information do I have available?
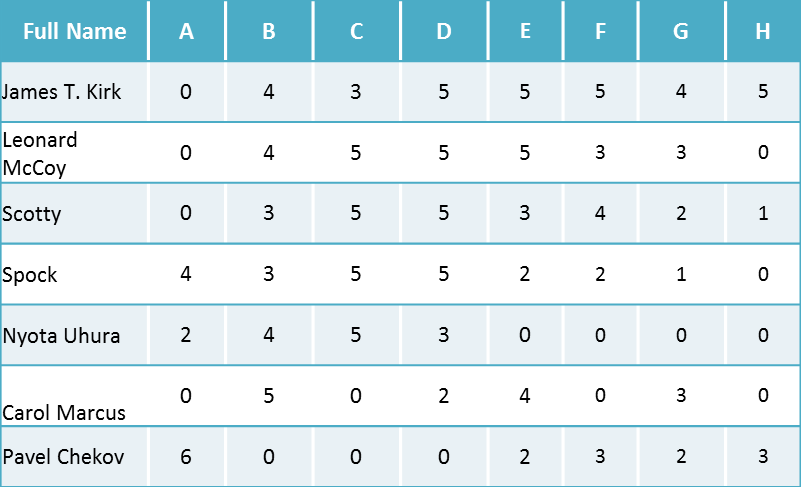
- What portion of the information it's really relevant?
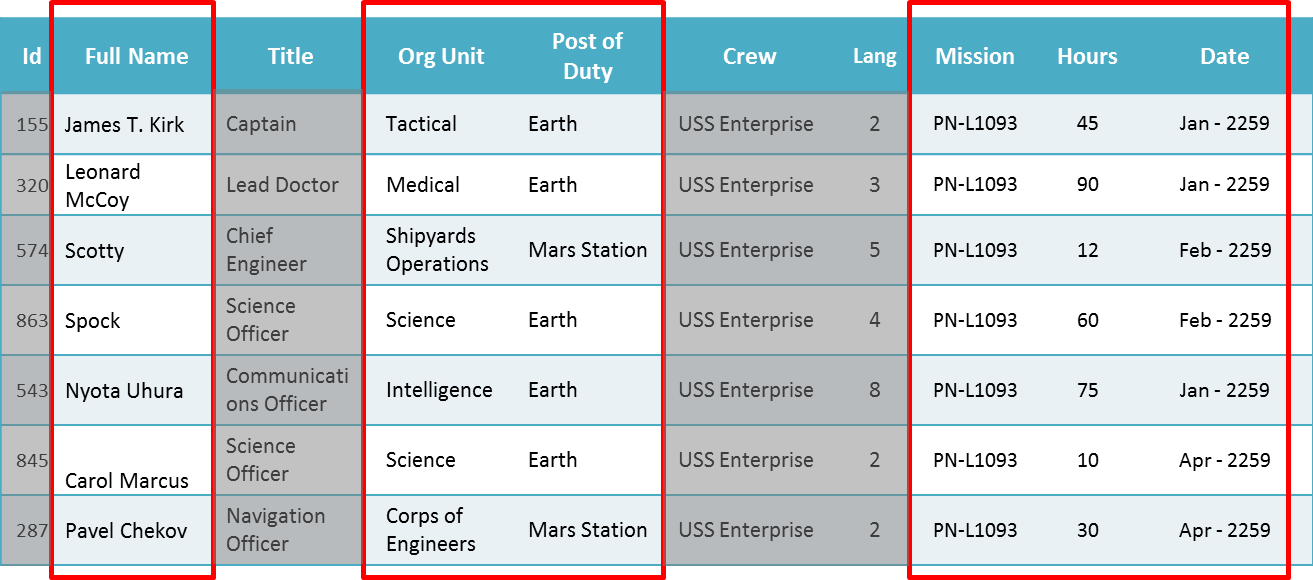
- How the relevant information can be represented graphically

Mockup
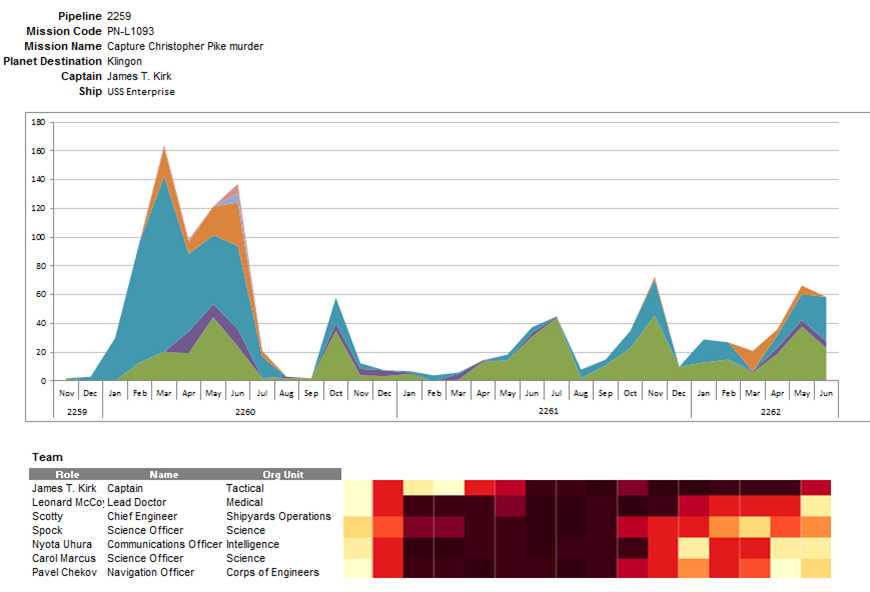
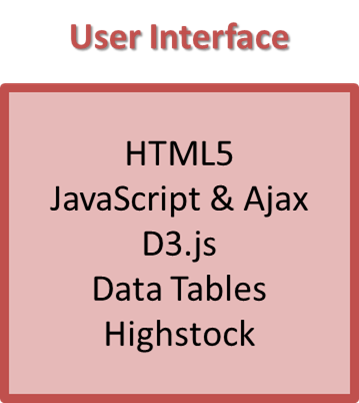
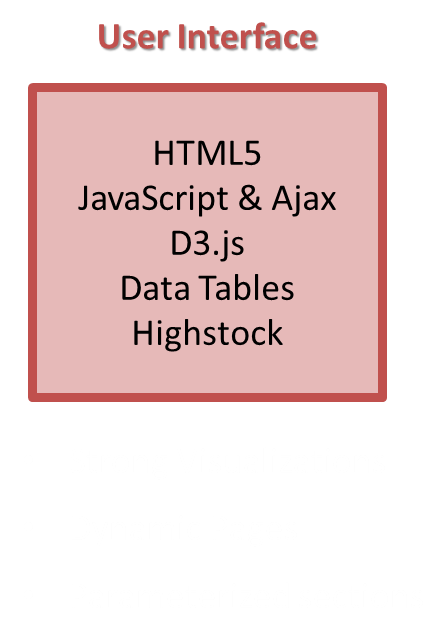
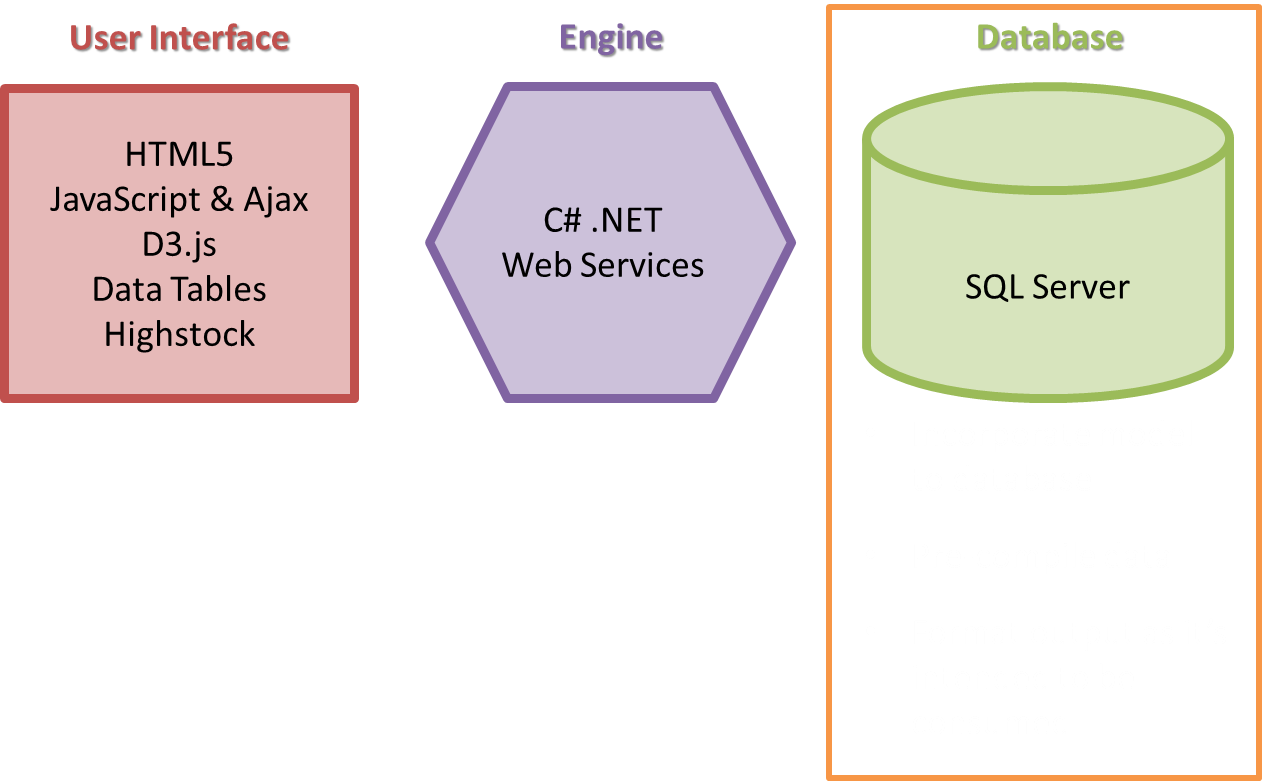
User Interface
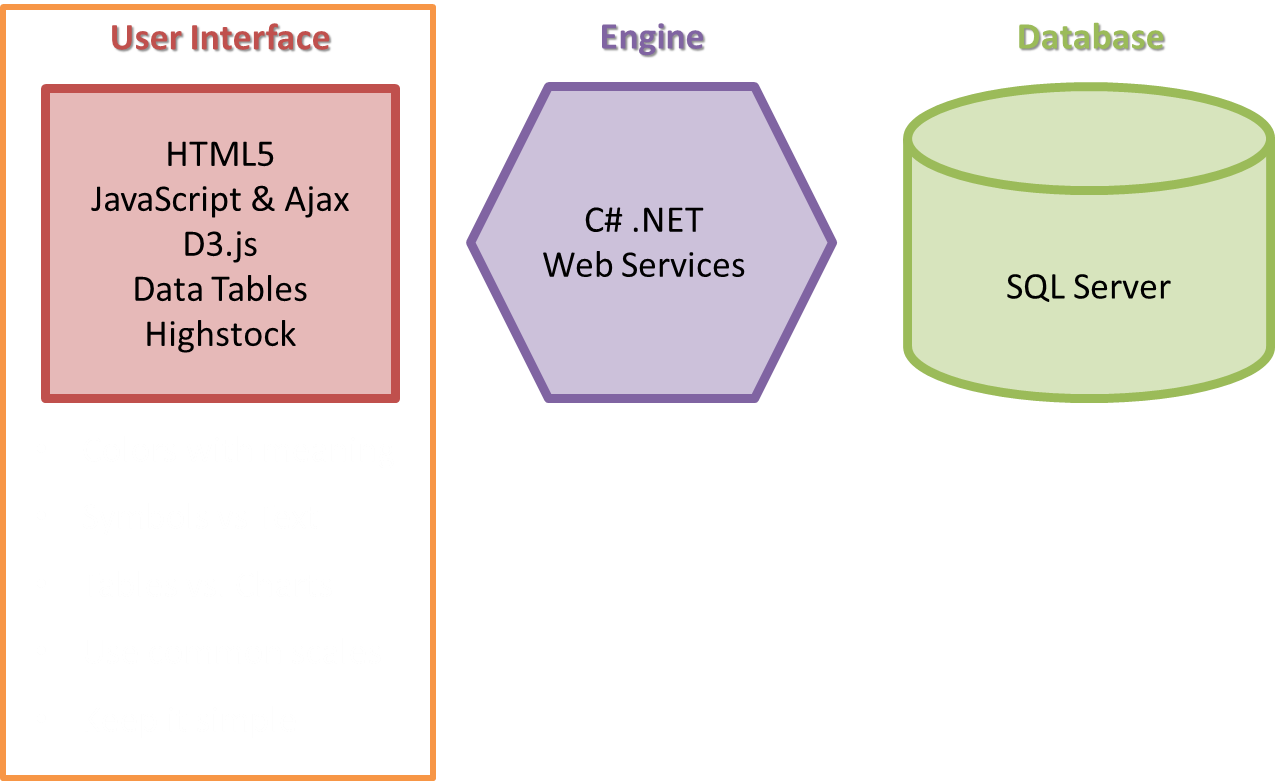
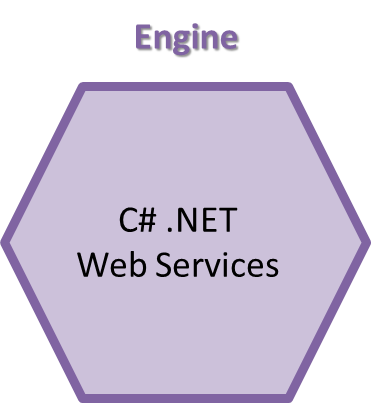
Engine
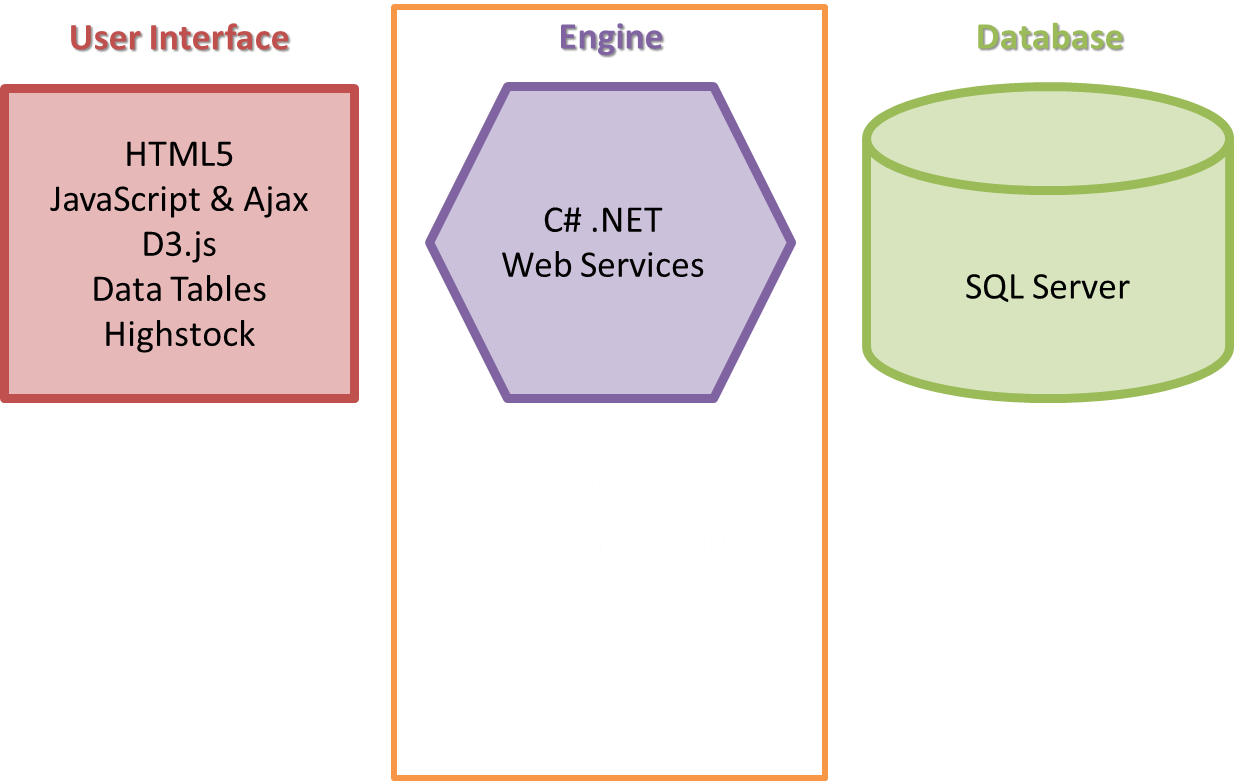
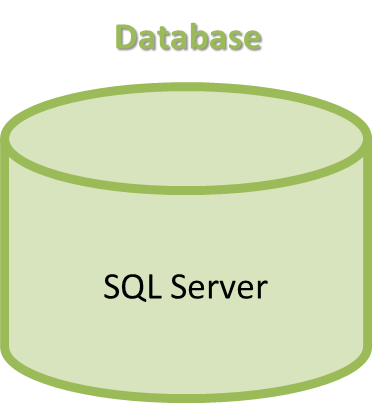
Database
- Backward Approach, starting from what do you expect from it
- Understand well the problem before start developing the solution
- Divide and conquer thinking, for complex problems divide them in smaller and tackle them alone